
INTRODUCTION
In today’s topic, I’d like to talk about the Meltdown and Spectre vulnerabilities. But not about the harm they cause, this has been covered widely in numerous articles, but how Microsoft patches intended to protect you from the vulnerabilities, affect (if they do) the hardware performance. Before we take a deep dive into the tests and numbers, let me tell a few words about Meltdown and Spectre and outline the testing scope to make sure we speak one language.
WHAT IS MELTDOWN?
Meltdown is a hardware vulnerability found in the number of processors, namely in Intel and ARM family processors. It allows an adversary (when executing a special program) to get unauthorized access to read from the memory used by the OS kernel. The vulnerability doesn’t affect the microprocessors from AMD and has an official reference CVE-2017-5754.
WHAT IS SPECTRE?
So, Spectre is a hardware vulnerability that affects most of the modern microprocessors, namely х86/x86_64 Intel and AMD and certain ARM CPU. The bad news is that it potentially allows local applications (when executing a special program) to get access to the content of the virtual memory of current application or other programs. It has two CVE indicators: CVE-2017-5753 and CVE-2017-5715.
Meltdown and Spectre attacks were noticed by Google Project Zero analysts. The blog pointed at three attack patterns on the CPU cache:
- rogue data cache load
- bounds check bypass
- branch target injection
These were formally described as similar vulnerabilities: Meltdown (first pattern) and Spectre (second and third). Potentially, hardware vulnerabilities can affect the performance of the hardware which leads to possible issues with the CPU-intensive workloads.
Anyway, the most important thing is that under all scenarios, the aim of the attacks is cache. Using different tricks, the processor caches byte values from the memory address unavailable for the attacker. The adversary doesn’t read the data itself (he can’t read cache from a random location). Instead, he calculates the mistakenly cached bytes in his address space, checking read latencies in different lines of the previously created volume.
When searching for protection against these vulnerabilities, I’ve hit several articles claiming that Microsoft patches may cause to downgrade your hardware performance. For a system administrator, performance may be just as important as security. That’s why I’ve decided to run a series of tests on Dell PowerEdge R720 server before and after patches installation to measure their performance influence. The testing result will be based on the following criteria:
- CPU
- RAM
- HDD
TESTING TOOLS
According to my experience and taste, well, sorry for that but that’s how it is, I’ve decided on four utilities: Aida64 5.95.4500 from Final Wire Ltd and Windows Server 2016 embedded utility – Winsat. I’ll use these to control CPU and RAM parameters. To compare the RAM and HDD parameters, I’ll use FIO 3.4 from Jens Axboe and DiskSpd 2.0.17 from Microsoft. I’ll also use DD (Disk Dump) 0.5 tool to fill the tested disks with some random data to increase the benchmark accuracy. Further, to create a RAM disk, I’ll go for DataRAMDisk 4.4.0.36 from Dataram inc and StarWind RAM Disk 5.8 from StarWind Software. These will also allow us to investigate the RAM performance in detail. And finally, the InSpectre 6b tool will be used to check if the vulnerabilities are present in the system.
Tests will be run on Dell PowerEdge R720 with Windows Server 2016 operating system.
Here is the hardware configuration:
- Intel Xeon E5-2660 v2.20GHz
- 128GB RAM Kingston
- 1x HDD WD – 1TB
- 1xSamsung SSD 960 EVO NVMe M.2 – 500GB
- 1x INTEL DC S3700 Series -2TB
- Windows Server 2016 (Version 10.0.14393)
TESTING PLAN
To make my intentions clear for everyone, here’s what I’m gonna do step-by-step:
- Check the system for vulnerabilities prior to testing with InSpectre
- Measure CPU and RAM performance with AID64 and WinSat
- Test the prepared disks (filled with random data using DD utility): Intel DC S3700 SERIES and Samsung SSD 960 EVO NVMe M.2 using FIO and DiskSpd tools
- Test RAMDisk with FIO and DiskSpd
- Update Windows with the latest cumulative patch protecting against Meltdown and Spectre using system update service. Check if updates are in place with InSpectre
- Repeat steps from 1 till 4
- Compare the results
CHECKING THE SYSTEM FOR MELTDOWN AND SPECTRE
To check if the system is protected against the vulnerabilities at the hardware and software levels, I’ve used InSpectre. You can download this tool by the following link: https://www.grc.com/inspectre.htm
After the first check, the tool showed that the system is vulnerable to both Meltdown and Spectre. That is right, I haven’t installed the patches yet. Let’s proceed further.

TESTING CPU
As mentioned above, I used AIDA64 v5.95.4500 and WinSat for that purpose.
AIDA64 is a Windows-based tool for testing components and provides detailed info on hardware and software utilized. During testing, I used the utility GPGPU benchmarks tool. Unfortunately, it doesn’t allow changing the settings.
To launch it, go to AIDA64=>Tools=>GPGPU benchmarks.
WinSat is a Windows-embedded utility allowing to measure the hardware performance. To run the test, execute the following command:
winsat cpuformal>> c:\winsat-cpu.txt. where c:\winsat-cpu.txt is a text file containing program testing results.
TESTING DISK SUBSYSTEM AND RAM
I’ve tested all disks without creating file systems on them. Prior to testing, I’ve filled disks with some random data using a DD tool. I’ve used the following commands for that:
- to get all disk names in the system, run: dd.exe –list
- dd.exe if=/dev/random of=\\?\Device\Harddisk1\Partition0 bs=1M –progress;
- dd.exe if=/dev/random of=\\?\Device\Harddisk2\Partition0 bs=1M –progress;
- dd.exe if=/dev/random of=\\?\Device\Harddisk3\Partition0 bs=1M –progress.
To test disk subsystem, I used DiskSpd v2.0.17 and FIO v3.4.
To squeeze maximum IOPS from SSD and RAM, I’ve determined the optimal load parameters for FIO and DiskSpd (number of threads, Outstanding I/O value).
The preliminary testing showed that with FIO and DiskSpd, SSD and RAM give the highest performance under the following parameters: Threads = 8 and Outstanding I/O = 16. So, all further tests will use these utility launch parameters.
DISKSPD
I used DiskSpd in my previous articles, and it’s quite popular, so you all know enough about it by now. Long story short, it’s a tool for synthetic storage subsystem testing and validation.
You can find the list of commands I used below:
|
1 2 3 4 5 6 7 |
diskspd.exe -t8 -Z1M -b4K -r -w0 -a0,2,4,6,8,10,12,14 -o16 -h -L -d300 -W300 #1> c:\DSPD\4k_random_read.txt diskspd.exe -t8 -Z1M -b4K -r -w100 -a0,2,4,6,8,10,12,14 -o16 -h -L -d300 -W300 #1> c:\DSPD\4k_random_write.txt diskspd.exe -t8 -Z1M -si -b64K -w0 -a0,2,4,6,8,10,12,14 -o16 -h -L -d300 -W300 #1> c:\DSPD\64k_seq_read.txt diskspd.exe -t8 -Z1M -si -b64K -w100 -a0,2,4,6,8,10,12,14 -o16 -h -L -d300 -W300 #1> c:\DSPD\64k_seq_write.txt |
For testing those disks remained, the disk name parameter was changed from #1 to #2 and #3 depending on the disk tested.
FIO
Another veteran – FIO. Just a few words about it – a handy tool for storage system performance testing. Also, it’s a cross-platform tool with open source code.
For working with FIO, I’ve used the configuration file with the following parameters:
|
1 2 3 4 5 6 7 8 9 10 11 12 13 14 15 16 17 18 19 20 21 22 23 24 25 26 27 28 29 30 31 32 33 34 35 36 37 38 39 40 41 42 43 44 45 46 47 48 49 50 51 52 53 54 55 56 57 58 59 60 61 62 63 64 65 66 67 68 69 70 71 |
[global] loops=1 time_based ramp_time=300 runtime=300 direct=1 ioengine=windowsaio cpus_allowed=0,2,4,6,8,10,12,14 filename=\\.\PhysicalDrive1 [4k 100%random 100% read] rw=randread bs=4k numjobs=8 iodepth=16 stonewall [4k 100%random 100% write] rw=randwrite bs=4k numjobs=8 iodepth=16 stonewall [64k 100%seq 100% read] rw=read bs=64k numjobs=8 iodepth=16 stonewall [64k 100%seq 100% write] rw=write bs=64k numjobs=8 iodepth=16 |
Depending on the drive tested, the filename parameter was changed to \\.\PhysicalDrive1, \\.\PhysicalDrive2, \\.\PhysicalDrive3.
I don’t show the results yet so that I could compare them all in the final table.
OK, we’re done with the first series of tests and can now start automatic system update and run further measurements.

Microsoft warns us that to fix the vulnerabilities both software and hardware system update is required, including BIOS. Also, we need to configure some additional settings for our OS as described in the following guide: https://support.microsoft.com/en-us/help/4072698/windows-server-guidance-to-protect-against-the-speculative-execution. When I was preparing this article, DELL website showed that the required BIOS version with fixed Spectre vulnerability was under development.


Therefore, I couldn’t run the full-fledged testing. However, I found it interesting how the system will perform if I install the Meltdown patch which doesn’t require BIOS update. The Meltdown protection was enabled by following the instructions provided above, but honestly, InSpectre allows doing that much faster. All you need to do is click the Enable Meltdown protection button and reboot the server. The protection state against Meltdown will be displayed as “System is Meltdown protected: YES”. In my case, the Spectre protection status remained the same: “System is Spectre protected: NO!”. Also, the performance state has been changed to “SLOWER”.

Further, I’ve performed all the tests on the updated system and gathered all the results.
COMPARING TESTING RESULTS FOR CPU AND RAM PERFORMANCE
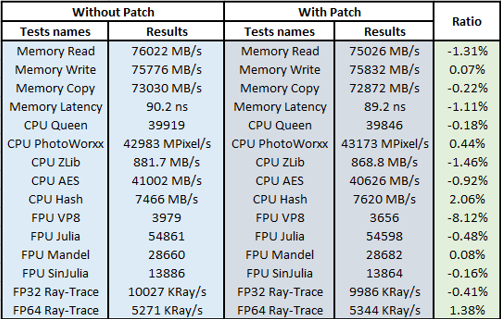
AIDA64
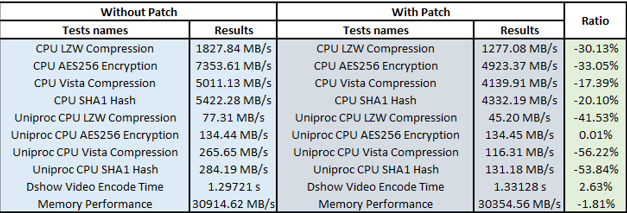
WinSat
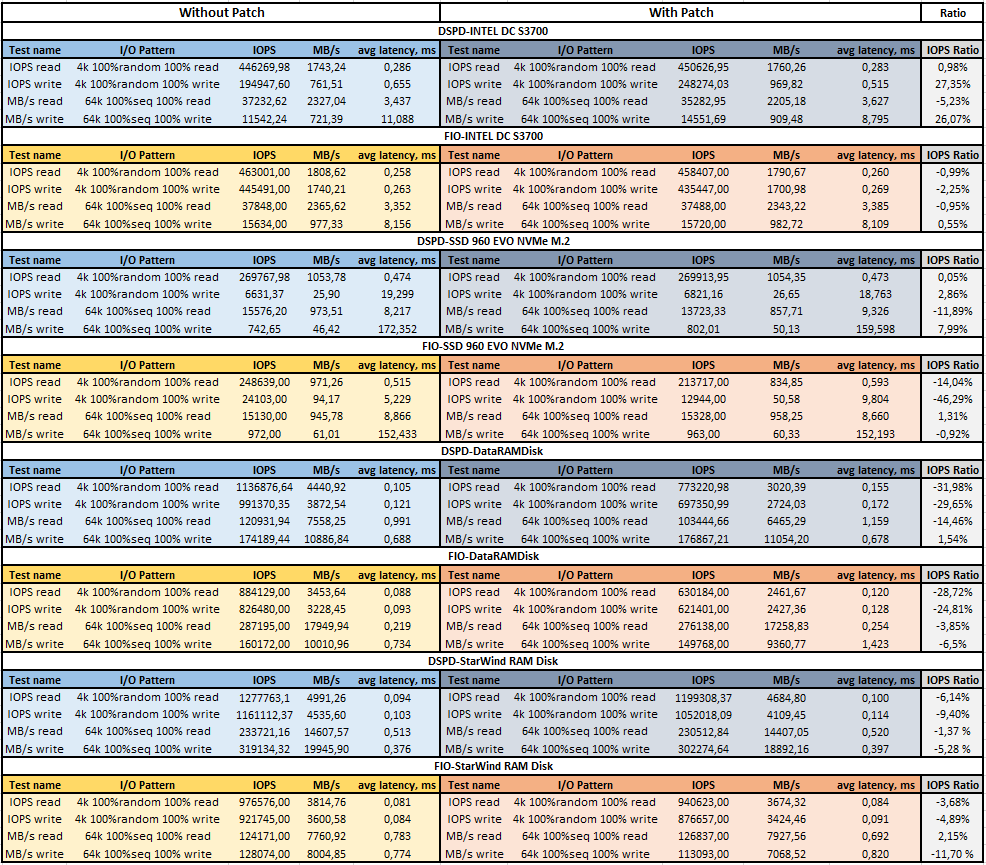
Comparing testing results for disks performance: Intel DC S3700, Samsung SSD 960 EVO NVMe M.2, and RAM Disks from DataRAM and StarWind
DiskSpd and FIO
CONCLUSION
I have conducted a series of tests to measure how Microsoft patches intended to protect the system against Meltdown and Spectre influence CPU, RAM and disk subsystem performance. By now, I’ve obtained the following results:
- All testing utilities point to the server performance downgrade, in different extent of course. You can see that in the “Ratio” column which indicates the performance changes after installing patches. The “-“ sign indicates the performance drop of the underlying hardware.
- Utilities show different outcome, although their input parameters remained the same. However, this can be explained by the utility peculiarities and we’re more interested in the results themselves.
- Having compared the CPU and RAM performance results with AIDA 64 tool prior to and after updates, we can see that the performance downgrade after the update is minimal. The largest performance drop of -8.12% was shown by the FPU VP8 test, which analyses the compression with Google VP9 video codec. However, I should also note the performance increase under certain parameters. The highest one (06%) is achieved under the CPU Hash test. This integer test determines the CPU performance using the hashing algorithm SHA1. It’s also possible that updates that are included in the Microsoft patch have influenced the result.
- Winsat, being a system utility, in its turn has shown more considerable performance changes. The lowest results were obtained under Uniproc CPU Vista Compression (-56.22%), Uniproc CPU SHA1 Hash (-53.84%), and Uniproc CPU LZW Compression (-41.53%). Well, the tool clearly says that the patch negatively affects the system performance.
- As to disks performance, DiskSpd for INTEL DC S3700 SERIES under the 4k random write pattern showed the performance increase by 27.35% and by 26.07% under the 64k seq write pattern. The performance downgrade was noticed only under the 64k seq read pattern (-5.23%). The FIO tool presented slight downgrades for the same disk and the lowest one was -2.25% under the 4k random write pattern.
- On the other side, considerable performance fall was noticed on the Samsung EVO-960 disk. FIO showed that its performance downgraded by -46.29% under the 4k random write pattern and by -14.04% under the 4k random read. As to DiskSpd, the 64k seq read pattern provided the worst result of -11.89% performance drop.
- The measurements held on StarWind RAM Disk also showed performance downgrade. FIO showed that the RAM performance dropped down by -11,7% under the 64k seq write, and by -4.89% under the 4k random write pattern. DiskSpd, in its turn, noticed the performance drop by -9.4% under the 4k random write and by -6.14% under the 4k random read. The good news is that the small performance increase by 2.15% was noted by FIO under the 64k seq read pattern.
- OK, brace yourselves… the worst results were received on the RAM disk by DataRAM. Both FIO and DiskSpd showed the performance downgrade under almost all testing patterns:
- -28.72% under the 4k random read for FIO and -31.98% for DiskSpd
- 4k random write? -24.81% and -29.65% correspondingly.
- the only pattern, according to DiskSpd, that remained within the limits of statistical margin was the 64k seq write (1.54%).
To sum up…all the testing results showed that 2018-02 Cumulative Update for Windows Server 2016 for x64-based Systems (KB4074590) intended to protect the system against Meltdown downgrades the server performance. After its installation, CPU, RAM, and HDD performance characteristics fall significantly. Sure, it’s up to you to decide: protection or speed? However, if performance is a key priority for your system, you won’t be happy if you install that patch.